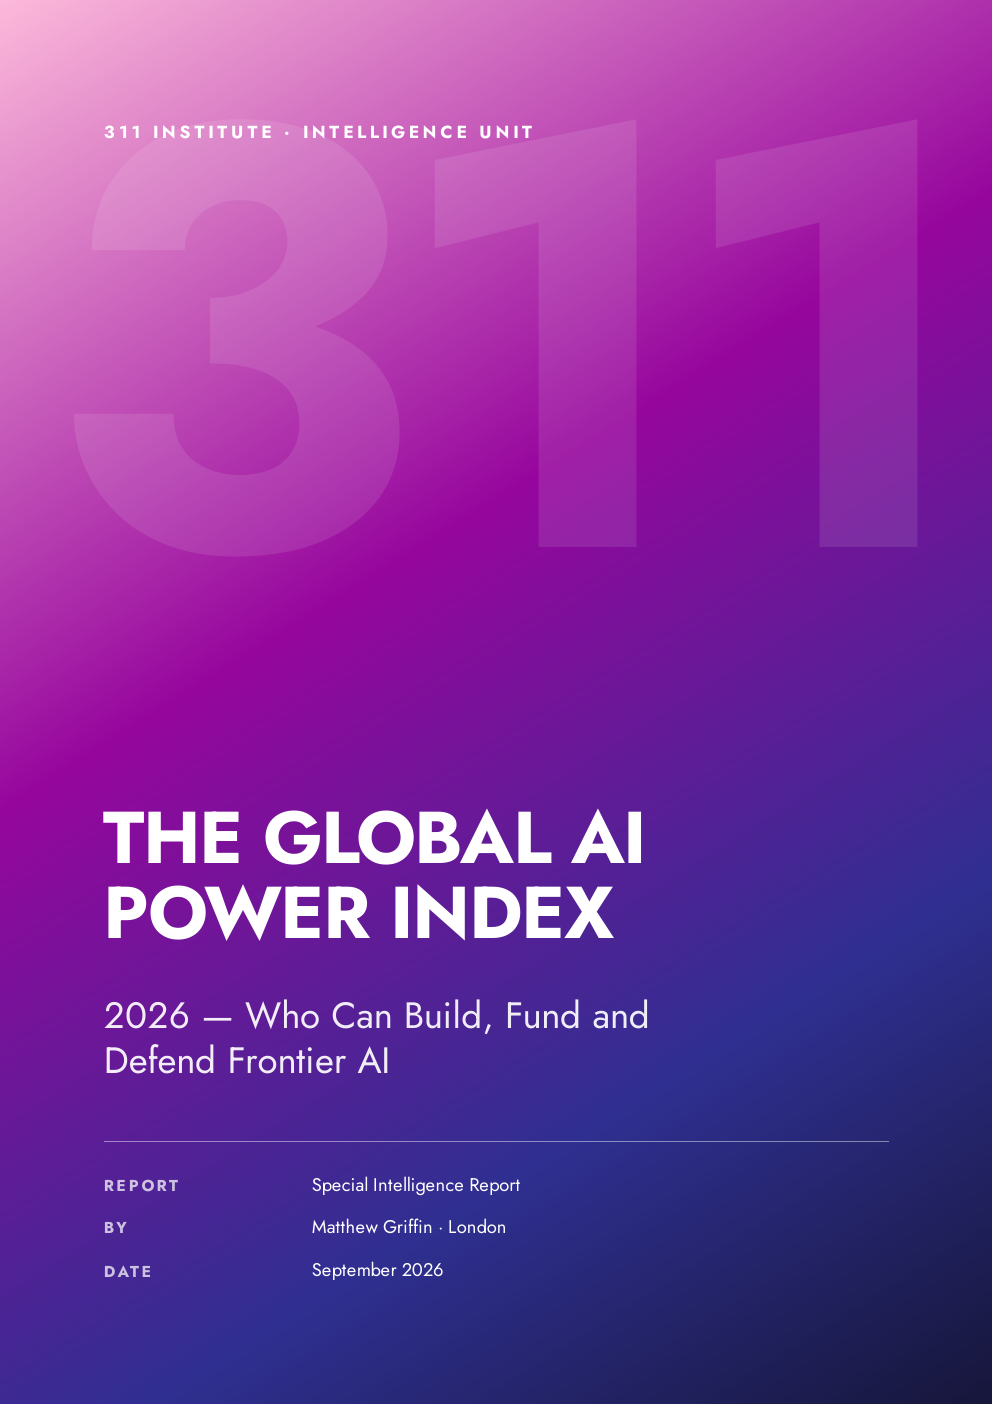
The short answer
Which country leads in AI?
The United States, with a score of 94.7 in the 311 Institute Global AI Power Index 2026, well ahead of China on 69.4 and Singapore on 40.2. The index ranks 93 countries on their ability to build, fund, use and protect advanced AI.
China is now within 2.7% of US performance on leading AI models, even though US private AI investment is 23 times as large. Singapore shows that a smaller country can compete through strong government, investment and real-world use.
By Matthew Griffin, 311 Institute · · Updated
Key facts
- 94.7the United States' score, first of 93 countries. 311 Institute Global AI Power Index 2026
- 69.4China's score, in second place. 311 Institute Global AI Power Index 2026
- 40.2Singapore's score, in third place. 311 Institute Global AI Power Index 2026
- 23×more private AI investment in the US than in China. 311 Institute Global AI Power Index 2026
- 2.7%China's gap to the US on the performance of leading AI models. 311 Institute Global AI Power Index 2026
- 8areas measured: computing power, research, people, investment, government, security, real-world use and speed of progress. 311 Institute Global AI Power Index 2026
The main finding
The United States and China are far ahead of everyone else.
The US has much more money and computing power. China, however, is now within 2.7% of US performance on leading AI models, even though US private investment is 23 times as large.
Singapore is third. It shows that a smaller country can compete through strong government, investment and real-world use.
AI power is about much more than having the best model
What decides which country leads in AI?
The US and China are in a league of their own.
The gap between China in second place and Singapore in third is larger than the gap across the rest of the top ten.
Size is not everything.
Singapore reaches third place through strong government, investment and real-world use.
More spending does not guarantee a bigger lead.
US private investment is 23 times as large as China's, but its lead on model performance is only 2.7%.
The ranking could change quickly.
Access to advanced chips, cheaper AI models and cyber security could shift the balance.
Places four to ten are a tight pack.
The UK and South Korea tie on 33.0, followed by France, Israel, Canada, the UAE and Germany, separated by low single digits. Each leads on a different pillar, and small changes in weighting reorder them.
China is winning on price.
DeepSeek's V4-Pro costs about $0.87 per million output tokens, against roughly $50 for a leading US model. Six of the ten most-used models on OpenRouter are now Chinese.
The full ranking
Find your country.
A higher score means a country is better placed to build, fund, use and protect advanced AI.
Four ways the board breaks by 2030
What could change the AI power rankings by 2030?
The report draws its pillar forecasts together into four ways the rankings could look by 2030. Each is tied to a named tripwire, and the odds are the report's qualitative read, not a model output.
-
By 2030High odds
Two poles hold: the US keeps its lead on capital and compute, and China stays close to parity. This is the base case the other scenarios are measured against.
-
By 2030Medium odds
Capability commoditises: open, cheap models erase the premium for having the best model.
-
By 2030Medium odds
The capex reckoning: the gap between AI spending and AI revenue forces the first big write-downs of AI infrastructure.
-
By 2030High odds
Agentic-cyber shock: autonomous AI attacks shift the advantage in cyber security to attackers.
Eight things decide whether a country can lead AI
What does the AI Power Index measure?
The report gives you the full ranking, a profile of every country and a clear look at each of these eight areas.
Computing power
Data centres, advanced chips and electricity.
Research
Leading models, important papers and patents.
People
Researchers, engineers, education and skills.
Investment
Private funding and successful AI companies.
Government
National plans, rules and public support.
Security
Cyber defence, safety and supply risks.
Real-world use
How widely AI is used across the economy.
Speed of progress
Whether a country is gaining or losing ground.
Every important number can be checked
How is the AI Power Index calculated?
Readers can see where each important number came from.
Where we calculate a missing figure, we explain how.
If reliable data does not exist, we do not invent it.
Bring the report to your organisation
Book Matthew Griffin to explain what this means for you.
Matthew will turn the findings into a clear session about your country, your industry and your organisation, then help your leaders decide what to do next.
Keynote
Give leaders, teams or event audiences a clear view of the global race for AI power.
Executive briefing
Give your board or senior leaders a private discussion focused on the risks and opportunities for your organisation.
Leadership workshop
Turn the report into priorities, choices and a practical plan for your organisation.
Tell us who the session is for and what you want it to achieve. We will suggest the right format.
Questions
The global AI race, answered
Which country leads in AI?+
The United States, with a score of 94.7 in the Global AI Power Index 2026. China is second on 69.4 and Singapore third on 40.2.
How close is China to the US in AI?+
China is within 2.7% of US performance on leading AI models, even though US private AI investment is 23 times as large. On overall AI power the US still leads by 25 points.
What does the report rank?+
It ranks 93 countries by their ability to build, fund, use and protect advanced AI.
Can I check the data?+
Yes. The report shows its sources, labels estimates and explains the full method.
Can Matthew present the findings?+
Yes. The research can be turned into a keynote, board briefing or workshop for your audience.
Which countries are in the top 10 for AI?+
The top 10 are the United States (94.7), China (69.4), Singapore (40.2), the UK (33.0), South Korea (33.0), France (31.1), Israel (30.5), Canada (28.7), the UAE (26.8) and Germany (26.4). Below the top two, places four to ten are separated by low single digits, and each country leads on a different pillar.
Is Europe falling behind in AI?+
Europe is competitive but lacks scale. The UK is the top European country at fourth, with France sixth and Germany tenth. The UK is strong on research but thin on scale. 81% of Europe's 2024 AI deals were seed or Series A, and France's gap to the leaders is capital and compute, not capability or strategy.
How does the AI Power Index differ from the Stanford AI Index?+
It weights compute, capital and governance more heavily, while Stanford's Global AI Vibrancy index weights research, talent and publications. The two agree strongly, with a rank correlation of about 0.72, and both put the US and China first and second. The main difference is third place: Singapore on 311, India on Stanford. India ranks sixteenth on 311.
What could change the AI race by 2030?+
The report sets out four scenarios. The base case is that two poles hold, with the US leading and China near parity (high odds). Cheap open models could erase the frontier premium (medium). A gap between AI spending and revenue could force write-downs (medium). Autonomous cyber attacks could shift the advantage to attackers (high).
Cite this report
Using these findings?
You are welcome to quote the findings with a link to this page. Please cite the report as:
Free to quote with credit and a link. Please ask before republishing whole sections, more than three charts or the PDF itself. How to use our research.
Griffin, M. (2026). The Global AI Power Index 2026. 311 Institute. https://www.311institute.com/global-ai-power-index-2026/
More 311 Institute research
Keep reading.
 Foresight studyThe Future of Data and Energy Transmission 2050What will carry the world's power and data to 2050, and who will control it?
 Foresight studyFuture of Work: One Person, 10,000 HandsWhat is the future of work when AI agents and robots can do the work of many people for one?
 Foresight studyThe Dead Internet Theory, PricedIs the dead internet theory true, and what does it cost to reach real people?
 RiskRogue AI and The Unkillable MachineCan you actually switch off a rogue AI?
 Market reportThe State of Global ICT InfrastructureHow big is the ICT infrastructure market, and what really limits it?
 CodexExponential Technology CodexWhy do emerging technologies matter to your organisation now?
 CodexAnnual Trends and Foresight CodexWhy do technology trends and megatrends matter to leaders now?
The libraryAll 311 Institute reports and codexesBrowse the full research library.
See the full picture.
Download the complete 180-page Global AI Power Index 2026.
Download the report (PDF, 6.2 MB)